师兄师姐都在偷偷用!这个工具出手就是PNS级水准!

Matplotlib、seaborn很强,但是,参数繁多
2026可视化工具TOP3
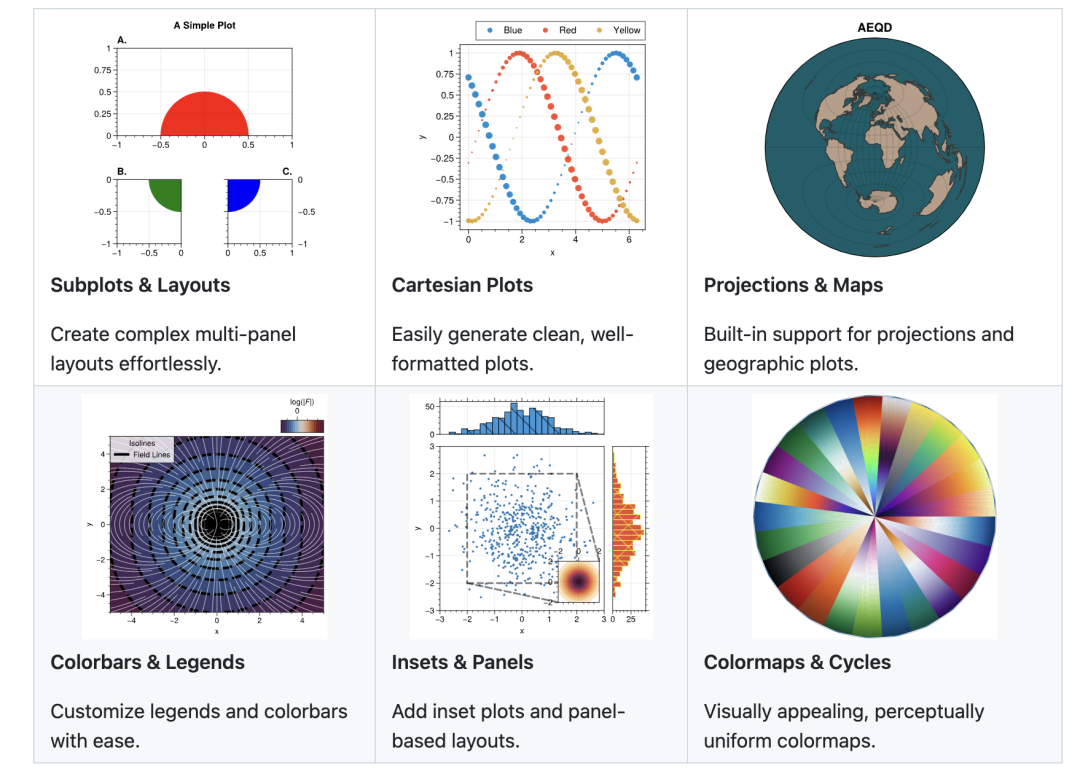
matplotlib的强力扩展UltraPlot,它是Python matplotlib繁杂参数的简化包装,少许代码,轻松实现publication-quality plots。

network
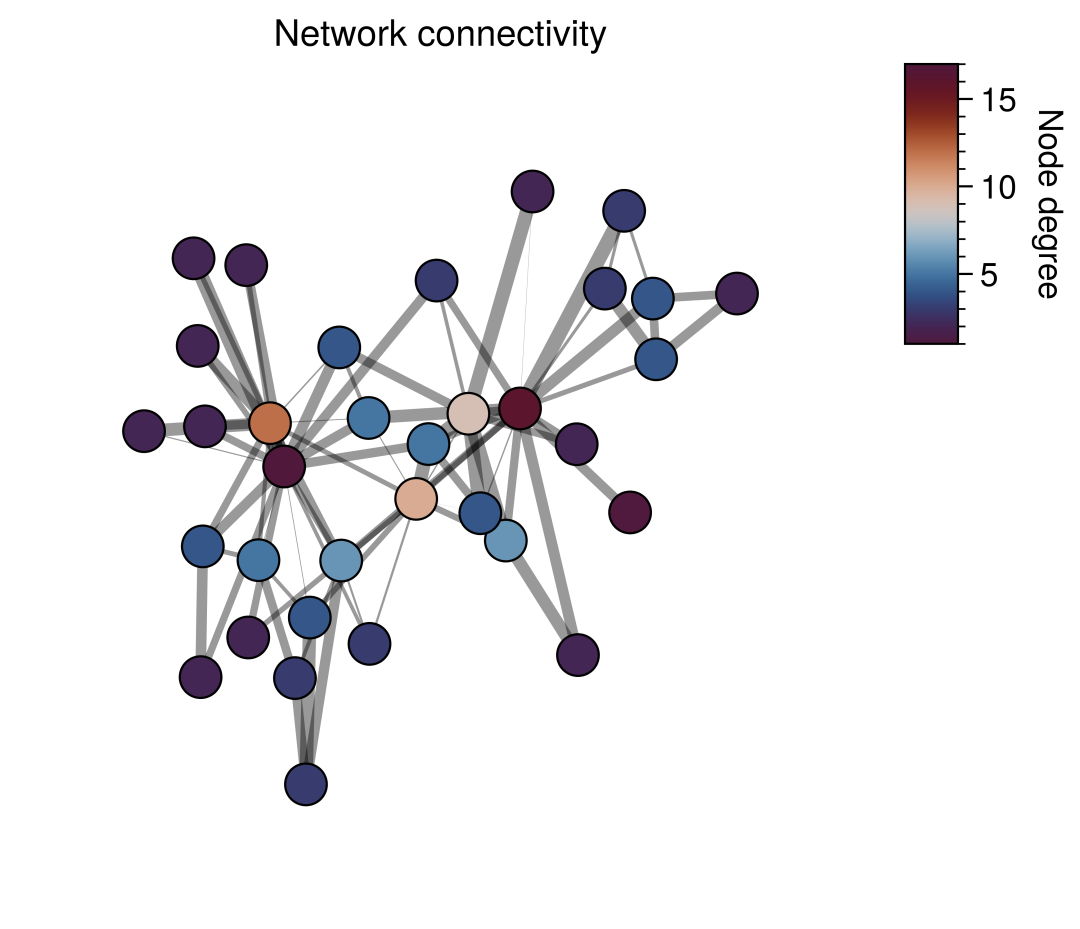
更多。。。。。。
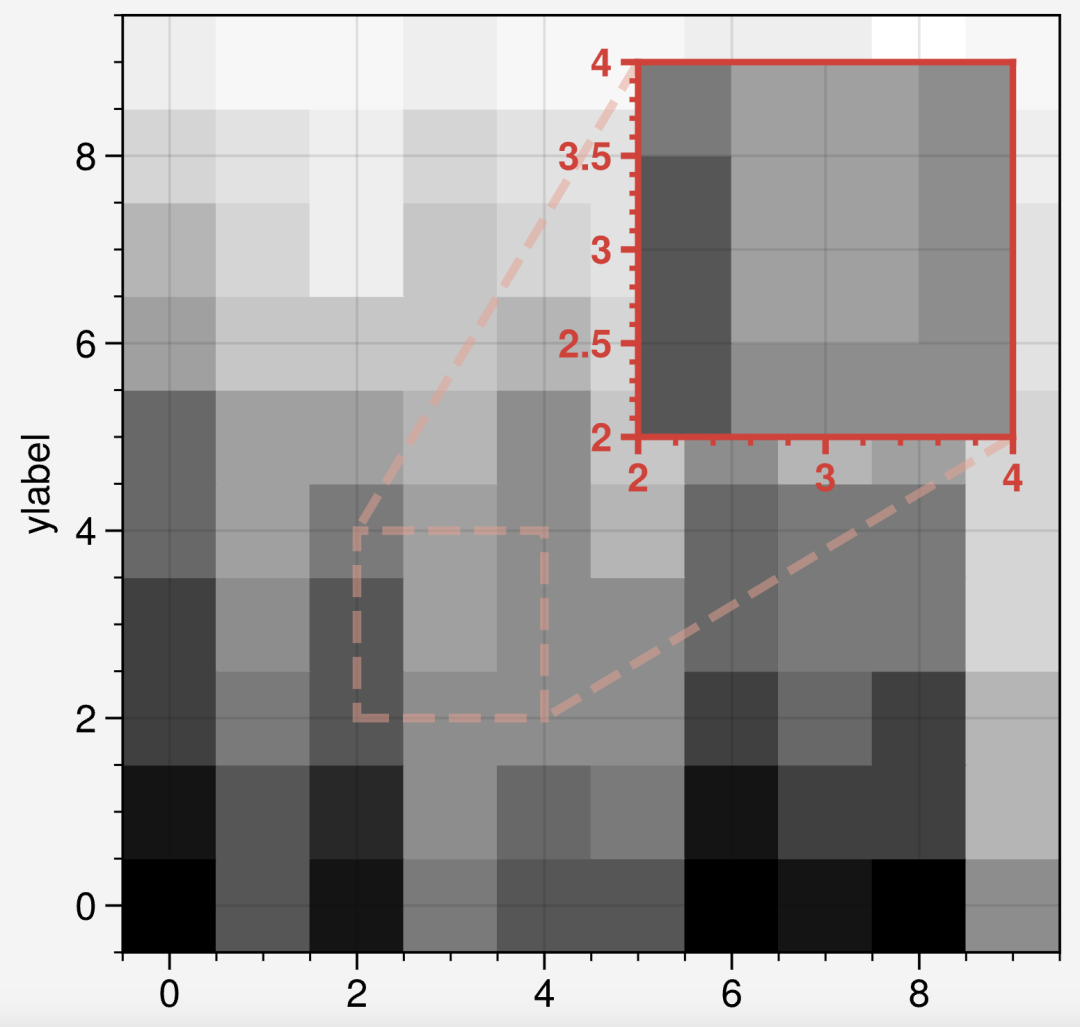
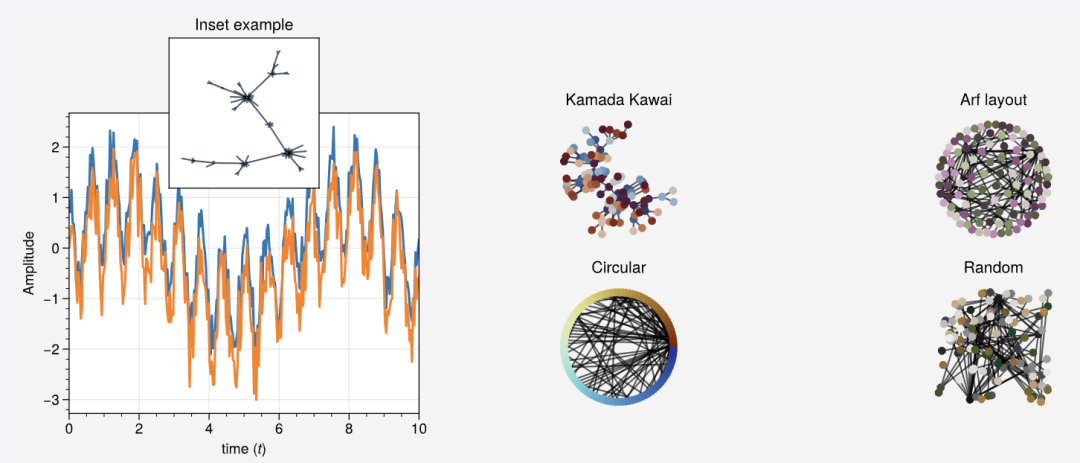
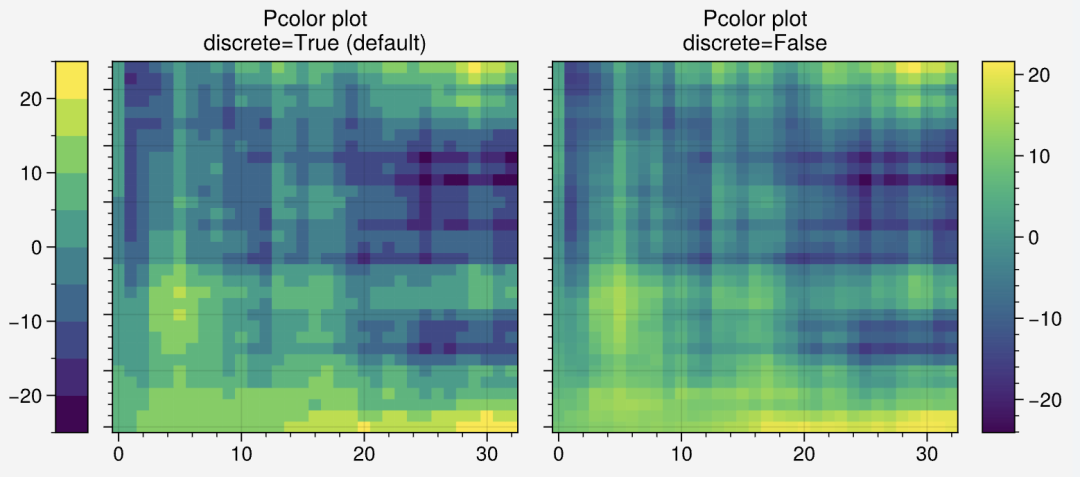
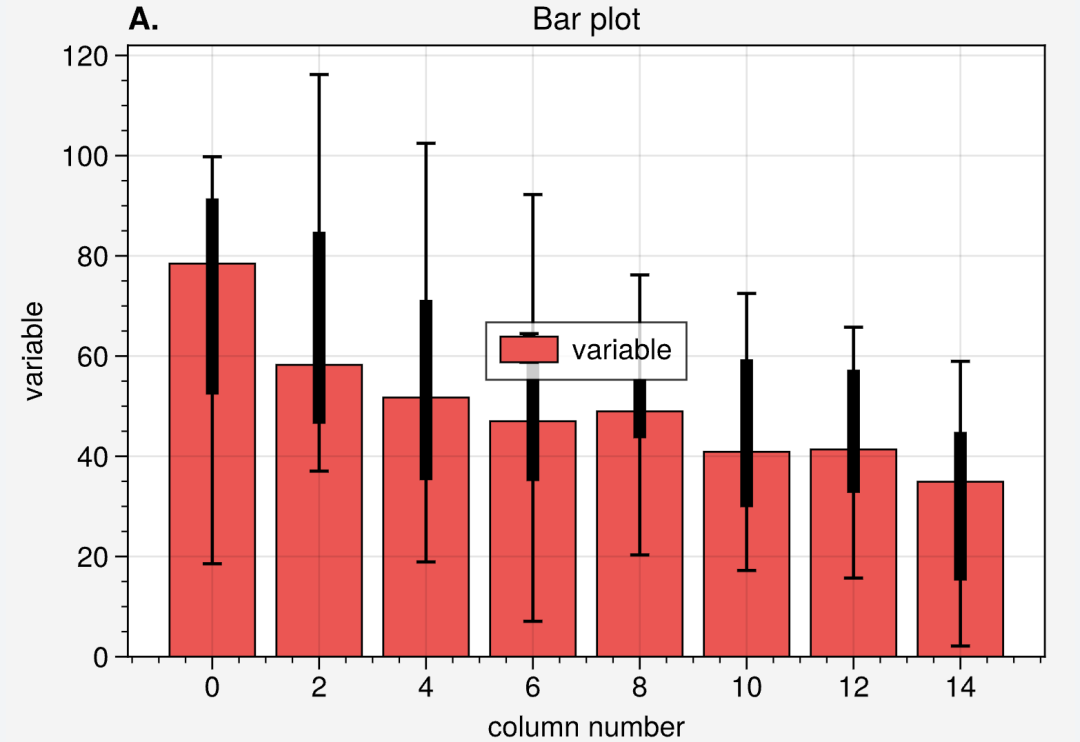
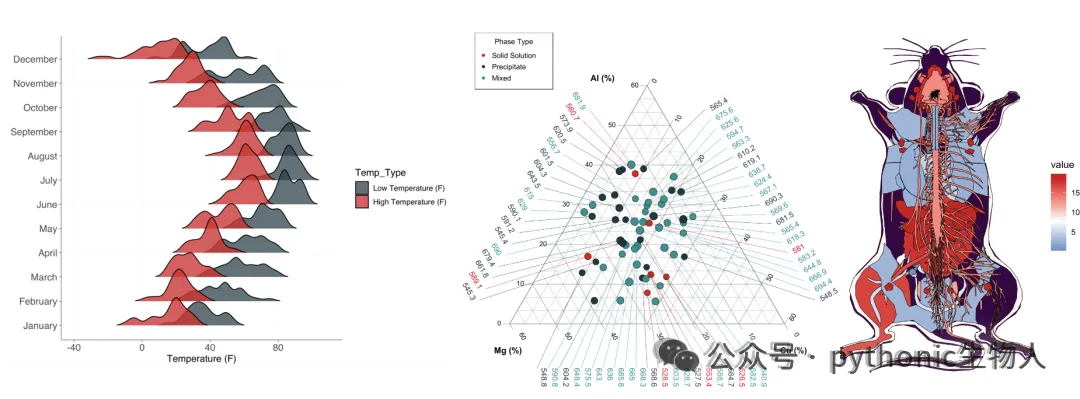
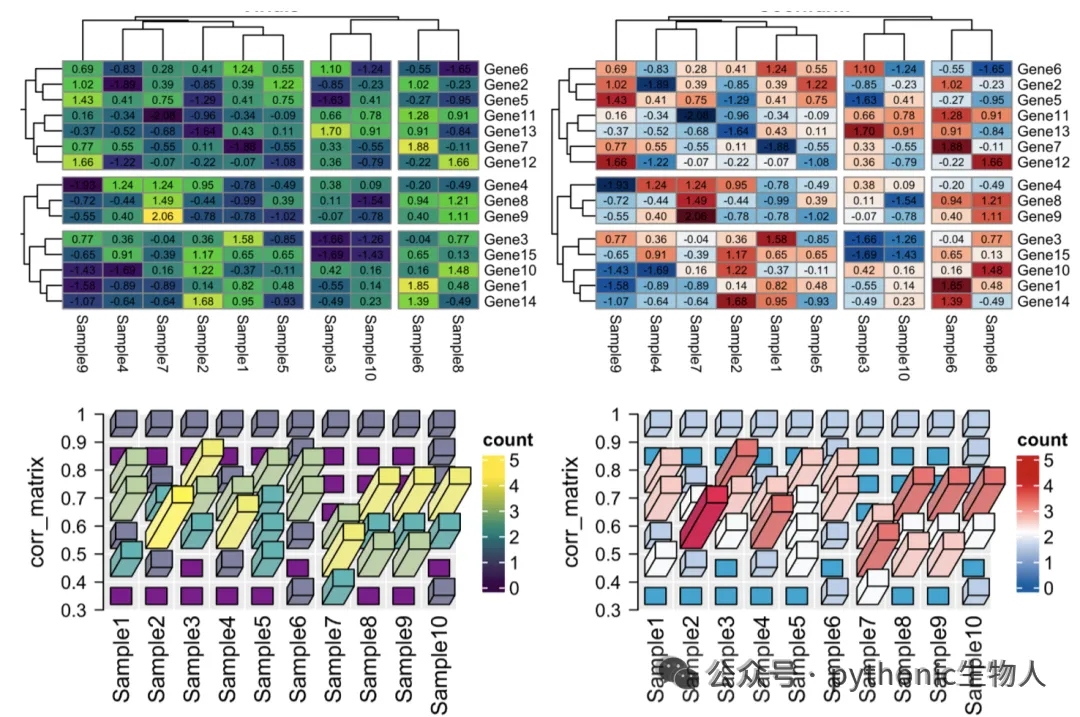
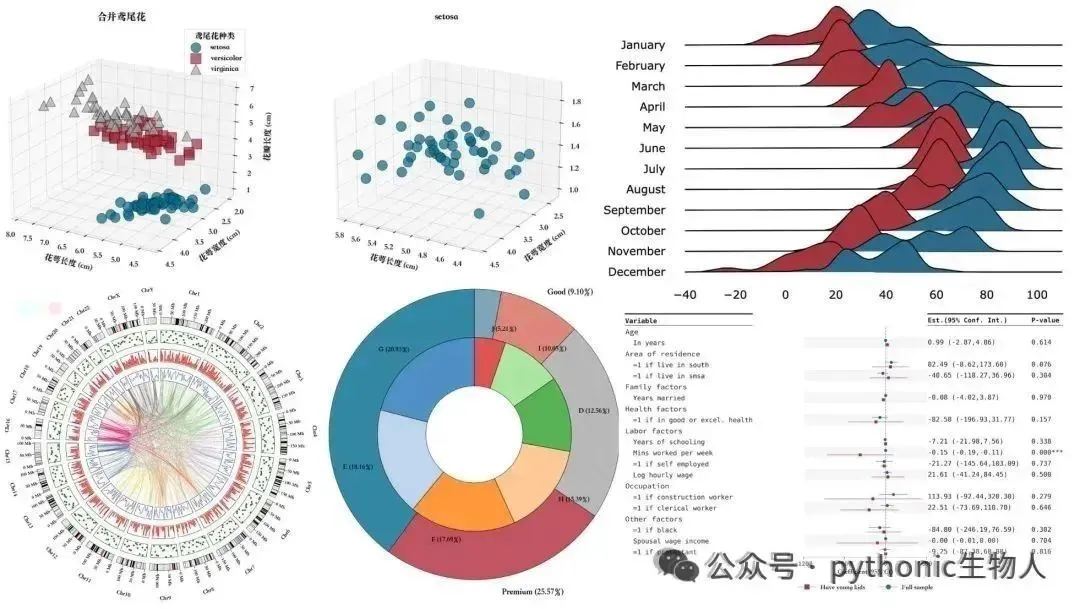
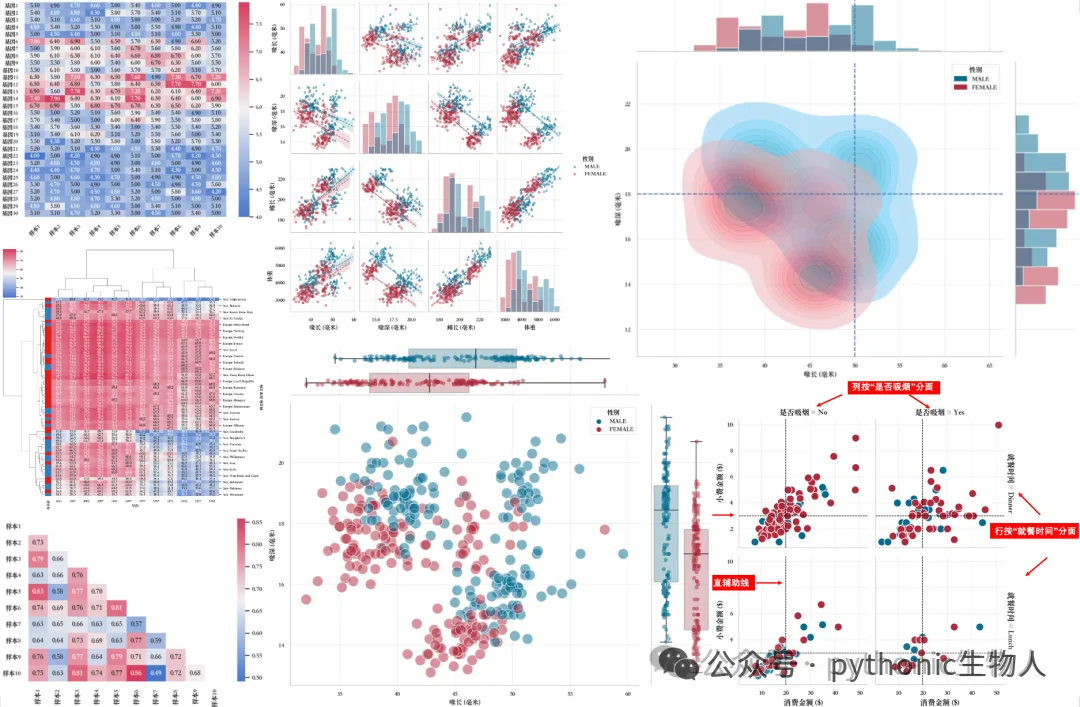

使用一下UltraPlot
- Chord diagram
ax.chord_diagram(matrix, ticks_interval=None, space=4)
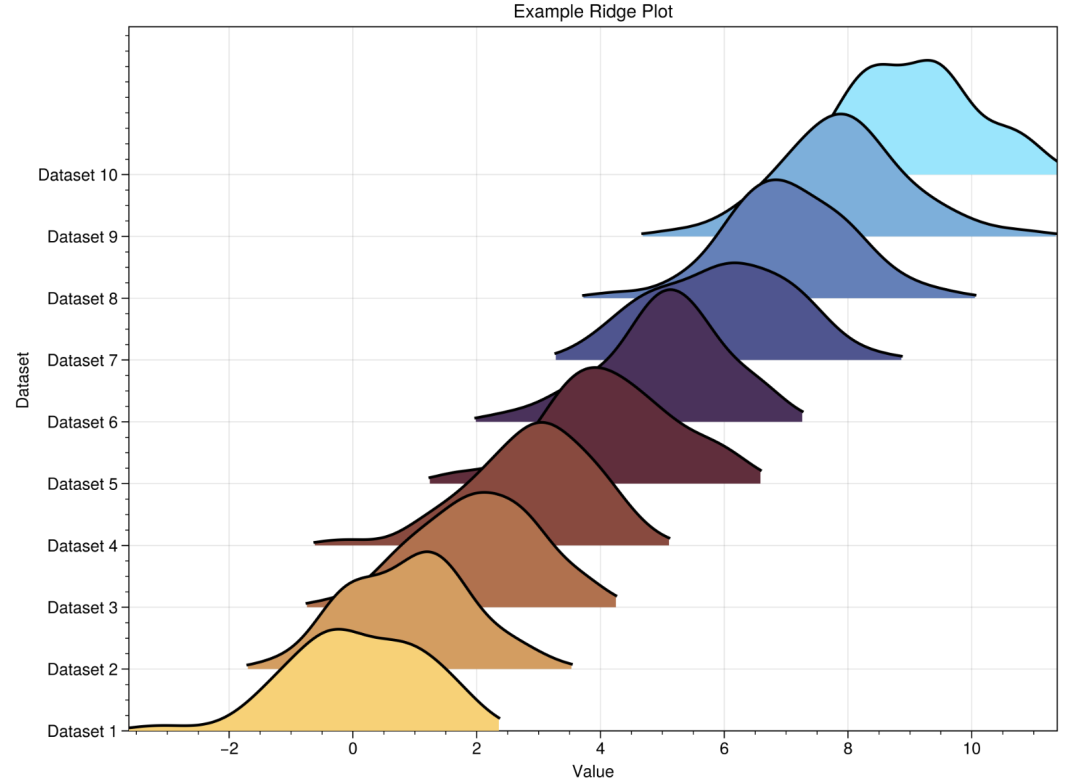
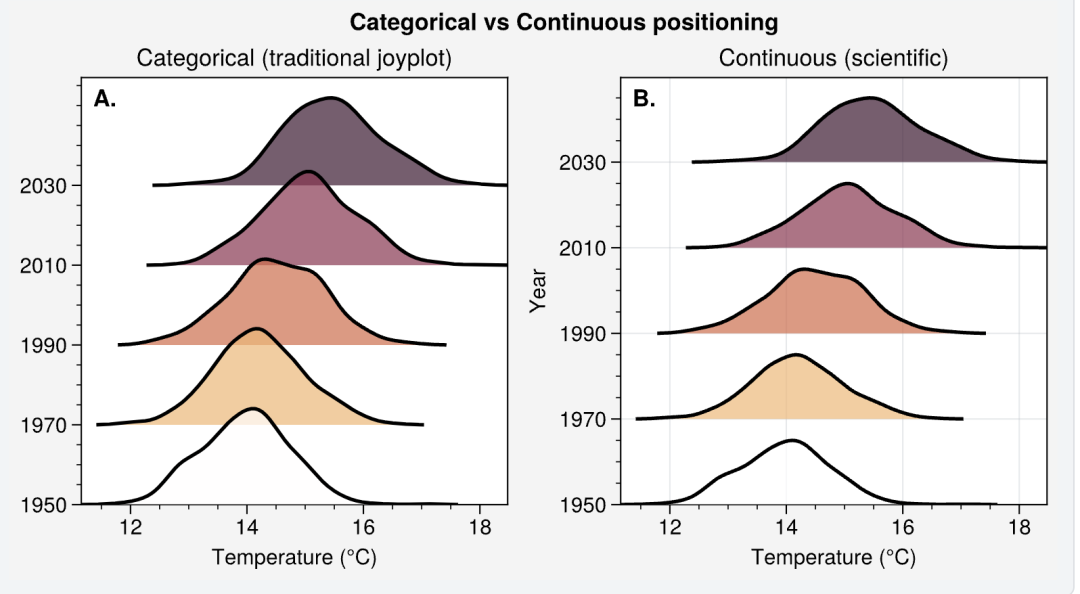
- Ridge Plot
ax.ridgeline(data, labels=labels, overlap=0.1, cmap="managua")
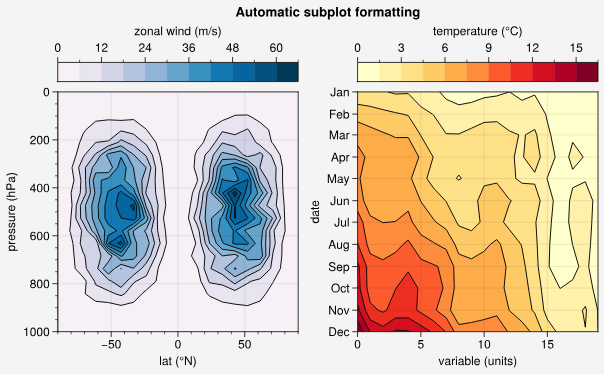
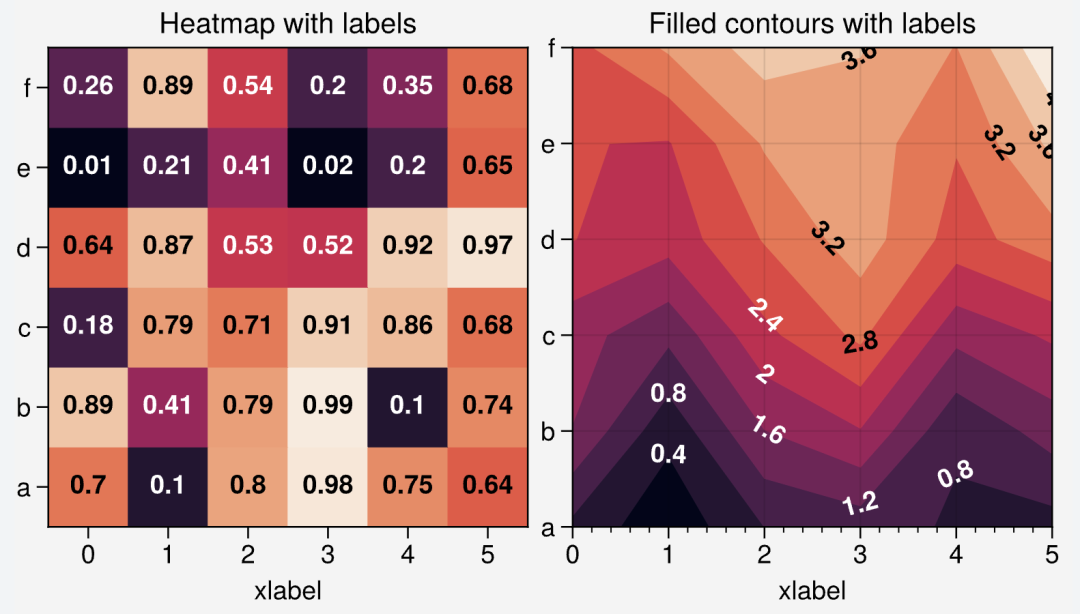
- 等高线 + heatmap
ax.contourf(df, cmap="YlOrRd", colorbar="t", lw=0.7, ec="k")
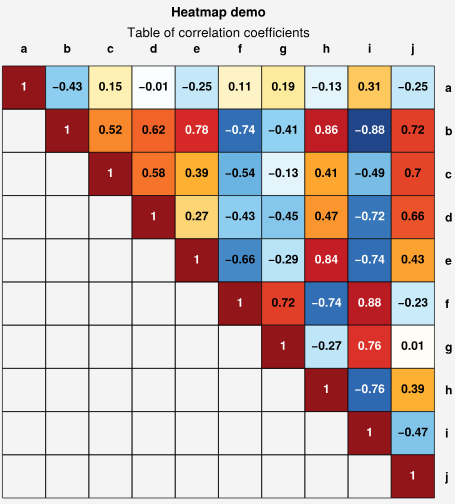
- 上三角heatmap
ax.heatmap(
    data,
    cmap="ColdHot",
    vmin=-1,
    vmax=1,
    N=100,
    lw=0.5,
    ec="k",
    labels=True,
    precision=2,
    labels_kw={"weight": "bold"},
    clip_on=False,  # turn off clipping so box edges are not cut in half
)
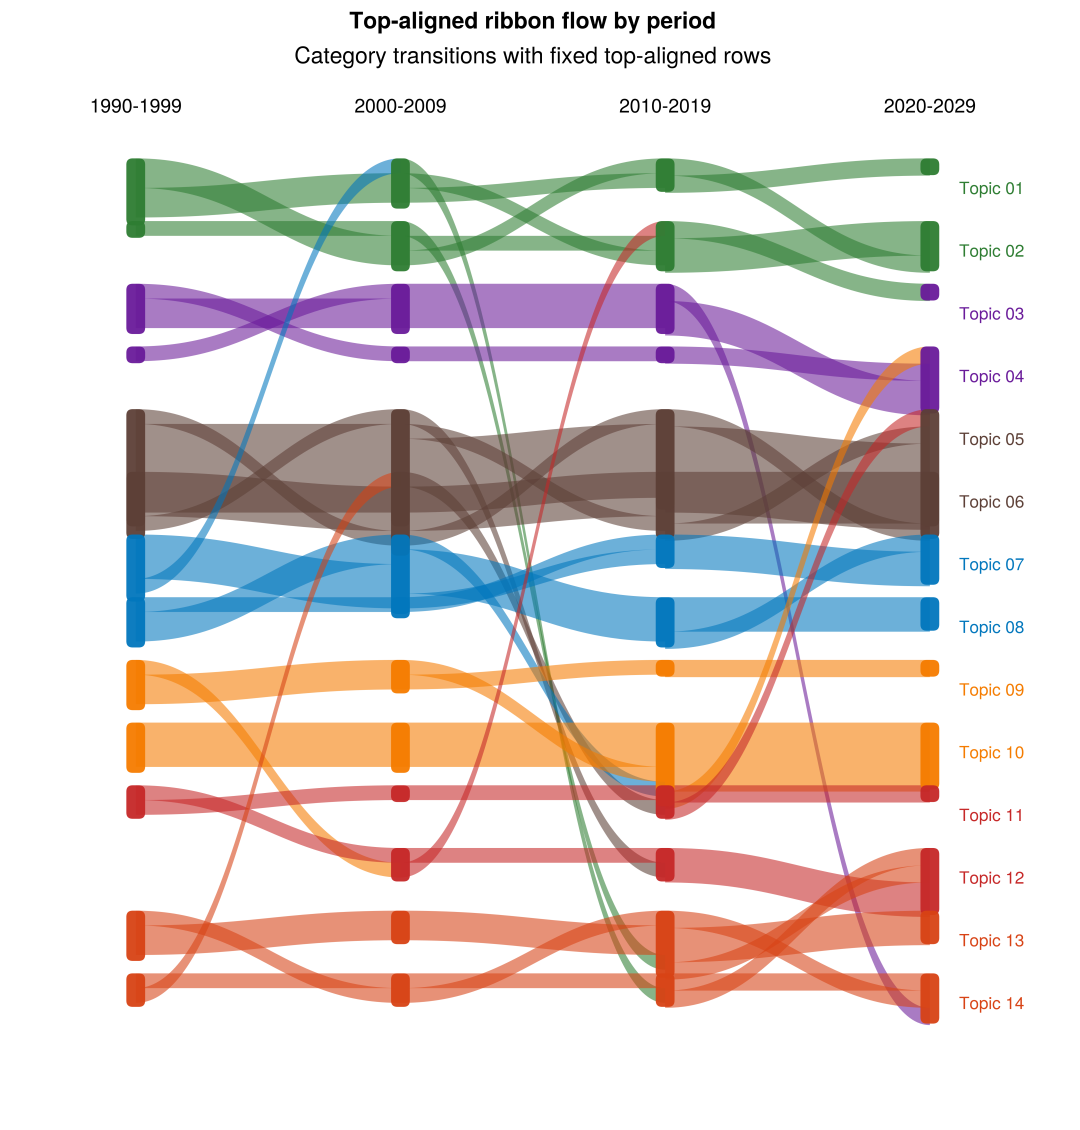
- 流向图
fig, ax = uplt.subplots(refwidth=6.3)
ax.ribbon(
    df,
    id_col="country",
    period_col="period",
    topic_col="topic",
    period_order=periods,
    topic_order=topic_order,
    group_map=TOPIC_TO_GROUP,
    group_order=group_order,
    group_colors=GROUP_COLORS,
)
nodes, edges, labels = ax.graph(
    g,
    layout="spring",
    layout_kw={"seed": 4},
    node_kw={
        "node_color": degrees,
        "cmap": "viko",
        "edgecolors": "black",
        "linewidths": 0.6,
        "node_size": 128,
    },
    edge_kw={
        "alpha": 0.4,
        "width": [np.random.rand() * 4for _ in range(len(g.edges()))],
    },
    label_kw={"font_size": 7},
)
装一下UltraPlot
pip install ultraplot
conda install -c conda-forge ultraplot